
Analytics & Measurement
Why Is My Ecommerce Conversion Rate Low? How to Use Analytics to Find What to Optimize First
If your ecommerce website is generating traffic but not enough sales, the first question should not be:
“What should we redesign?”
It should be:
“Where are customers dropping out of the buying journey, and why?”
A low ecommerce conversion rate can come from many different problems. The wrong traffic may be reaching the site. Visitors may struggle to discover the right products. Product pages may not provide enough information or confidence. Customers may add products to their carts but abandon before checkout. Mobile shoppers may encounter friction that desktop users do not.
Or the website may be performing better than you think in some areas and significantly worse in one particular part of the journey.
Without diagnosing the problem first, optimization becomes guesswork.
That is why growing ecommerce brands should use analytics to identify where the greatest conversion opportunity exists before deciding what to change.
What Does a Low Ecommerce Conversion Rate Actually Tell You?
Conversion rate is useful, but by itself it does not tell you what is wrong.
Suppose an ecommerce brand sees its conversion rate decline.
The immediate reaction might be to redesign the homepage, change product photography, offer a discount or modify the checkout.
Any of those changes could help.
They could also have nothing to do with the actual problem.
A conversion rate is the outcome of an entire customer journey.
Customers may move through stages such as:
Landing → Product Discovery → Product View → Add to Cart → Checkout → Purchase
A problem anywhere along that journey can affect the final conversion rate.
The first objective should therefore be to break the overall number into smaller questions.
Are visitors reaching product pages?
Are product viewers adding items to their carts?
Are customers who add to cart beginning checkout?
Are customers who begin checkout completing their purchase?
Which traffic sources convert?
Which devices struggle?
Which landing pages introduce high-value customers?
Which products create engagement but fail to generate purchases?
Once you start asking those questions, “our conversion rate is low” becomes a much more actionable business problem.
Start With the Ecommerce Funnel, Not the Homepage
One of the most useful places to begin is the purchase funnel.
Google Analytics 4 provides a Purchase Journey report designed specifically to show how users move through stages of an ecommerce funnel and where they drop off.
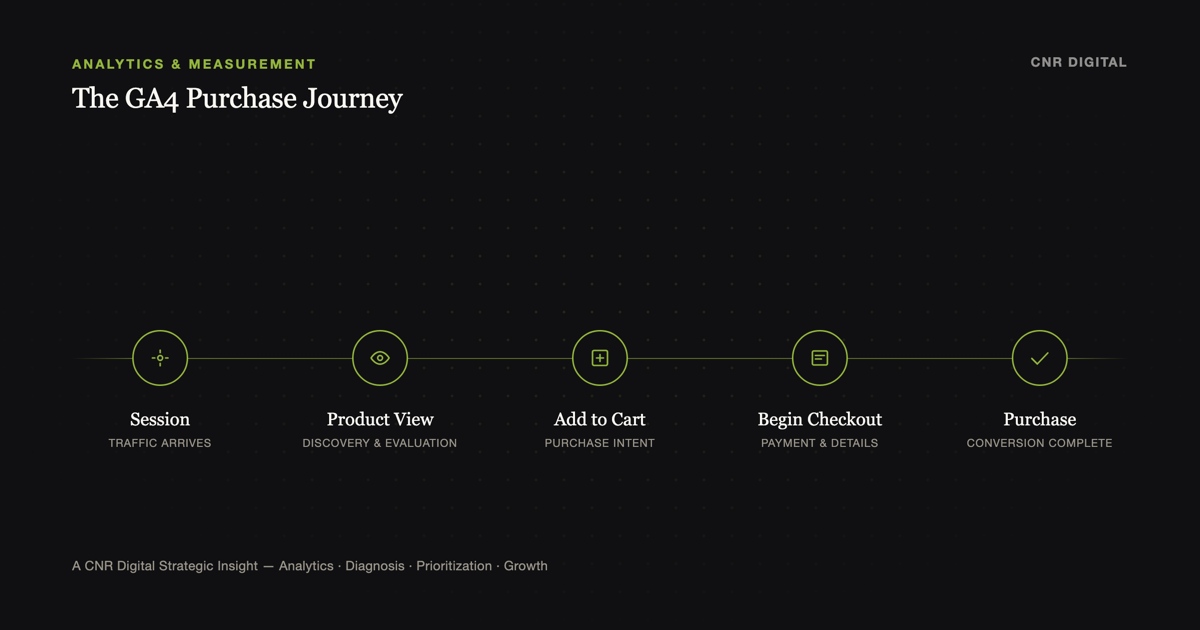
A simplified journey might look like:
Session → Product View → Add to Cart → Begin Checkout → Purchase
The GA4 Purchase Journey
Instead of looking only at the percentage of sessions that become purchases, examine the transitions between each stage.
High traffic, low product viewing
If many visitors arrive but relatively few explore products, investigate the top of the experience.
Possible questions include:
- Are landing pages aligned with the marketing message that brought visitors there?
- Can customers quickly understand what the brand sells?
- Is product discovery intuitive?
- Are collections and categories organized around how customers actually shop?
- Are paid campaigns sending visitors to appropriate landing pages?
This could be a merchandising, acquisition or landing-page problem rather than a checkout problem.
Strong product views, weak add-to-cart behavior
If customers are viewing products but rarely adding them to their carts, focus more closely on the product experience.
Consider:
- value proposition
- product descriptions
- imagery
- pricing
- sizing or specifications
- shipping expectations
- returns information
- product availability
- reviews and social proof
- mobile usability
- calls to action
The objective is not to blindly add more content.
It is to understand what information or confidence customers need before they are willing to move forward.
Strong add-to-cart behavior, weak checkout initiation
This is a different problem.
Customers have already demonstrated meaningful purchase intent.
Now investigate what happens between the cart and checkout.
Unexpected costs, unclear shipping information, promotional-code distractions, cart usability or uncertainty about the purchase can all deserve investigation.
The important point is that you would prioritize this differently from a product-discovery problem.
Strong checkout initiation, weak purchase completion
Now the analysis should become even more focused.
GA4's Checkout Journey report can help businesses examine how customers who begin checkout progress toward completing a purchase.
If significant friction occurs late in the journey, investigate areas such as:
- payment options
- shipping costs
- delivery expectations
- form friction
- account requirements
- technical errors
- mobile checkout experience
- coupon-code behavior
- payment failures
A homepage redesign would probably not be the first thing to prioritize if customers are consistently reaching checkout and abandoning there.
That is why funnel diagnosis matters.
Segment Before You Draw Conclusions
Aggregate conversion rate can hide important differences.
Imagine that your overall ecommerce conversion rate declined this month.
Before assuming the website itself became worse, segment the data.
Traffic source
Compare meaningful acquisition sources.
You might discover that returning email visitors convert strongly while a newly scaled paid campaign generates substantial traffic but very few purchases.
In that situation, the website's overall conversion rate may have fallen partly because the composition and quality of traffic changed.
That is a different business problem from an across-the-board website conversion issue.
Device
Compare mobile and desktop journeys.
Do not stop at overall conversion rate.
Examine where the funnels begin to diverge.
If mobile users view products at similar rates but abandon disproportionately when interacting with the cart or checkout, you now have a much narrower investigation.
New vs. returning customers
New customers and returning customers may behave differently.
Returning customers already know the brand.
New customers may require more explanation, trust, product education or reassurance before purchasing.
Understanding that difference can influence landing pages, merchandising, remarketing and customer-acquisition strategy.
Product and category
A sitewide conversion metric can also hide major differences between products.
Some categories may attract large amounts of browsing but weak purchase intent.
Others may generate fewer visits but significantly stronger customer behavior.
This is where analytics begins influencing merchandising and investment decisions, not just website design.
Don't Confuse a Traffic Problem With a Conversion Problem
This distinction can save an ecommerce brand significant time and money.
Suppose sales decline and conversion rate falls.
The website gets blamed.
But analysis shows that organic, direct and email traffic continue converting at normal levels while a newly expanded acquisition channel produces thousands of low-engagement visits.
The primary problem may not be conversion optimization.
It may be traffic quality.
The reverse can happen too.
Marketing may continue bringing qualified visitors to the website, but product-view-to-cart or checkout completion begins deteriorating.
Now the experience deserves greater scrutiny.
Growing brands need to connect acquisition analytics and website analytics rather than evaluating them in separate silos.
The question is not simply:
“How much traffic did marketing generate?”
It is:
“What happened after that traffic arrived?”
Look Beyond GA4 to Understand Why Customers Struggle
Quantitative analytics is excellent at identifying where something appears to be happening.
It does not always explain why.
Suppose your funnel analysis identifies unusually high abandonment on a particular product template.
That is where qualitative analysis becomes valuable.
Depending on the situation, you might review:
- session recordings
- heatmaps
- customer support questions
- on-site search behavior
- customer reviews
- usability feedback
- surveys
- technical errors
- page-speed and performance data
The combination is powerful.
Analytics identifies the pattern.
Customer-behavior evidence helps explain the pattern.
Together, they create a stronger optimization hypothesis.
Turn Analytics Into an Optimization Hypothesis
Analytics should lead to action.
But the action should not be:
“Conversion is down, so let's redesign the site.”
A better process is:
Observation → Diagnosis → Hypothesis → Test → Measurement
Turning Analytics Into a Hypothesis
For example:
Observation: Mobile shoppers reach product pages but add products to cart at a much lower rate than desktop shoppers.
Diagnosis: Review mobile product-page behavior, page performance, product information, variant selection and CTA usability.
Hypothesis: Customers may be struggling to select product variants and reach the primary Add to Cart action efficiently on smaller screens.
Test: Improve the mobile product-selection and CTA experience.
Measurement: Compare product-view-to-add-to-cart behavior and downstream purchase performance.
Worked Example
- Observation
- Mobile shoppers reach product pages but add products to cart at a much lower rate than desktop shoppers.
- Diagnosis
- Review mobile product-page behavior, page performance, product information, variant selection and CTA usability.
- Hypothesis
- Customers may be struggling to select product variants and reach the primary Add to Cart action efficiently on smaller screens.
- Test
- Improve the mobile product-selection and CTA experience.
- Measurement
- Compare product-view-to-add-to-cart behavior and downstream purchase performance.
Notice how much more specific this is than:
“We should improve mobile.”
Specific hypotheses create measurable optimization.
Prioritize Opportunities by Business Impact
Growing ecommerce brands rarely have only one possible improvement.
There may be dozens.
The challenge is deciding what deserves attention first.
A useful prioritization framework considers four things:
1. Size of the opportunity
How many customers encounter this part of the journey? A problem affecting a high-volume product template may deserve more attention than an issue on a rarely visited page.
2. Severity of the friction
How significant is the behavioral drop-off? Is this normal attrition through a funnel, or does the data indicate an unusually weak transition?
3. Business value
Which products, customer groups or journeys contribute most meaningfully to revenue and customer value? Not every conversion has equal strategic importance.
4. Confidence in the diagnosis
How much evidence supports the hypothesis? One unusual metric should not automatically trigger a major redesign. Look for supporting evidence across analytics, customer behavior and business context.
- 1
Size of the opportunity.
How many customers encounter this part of the journey? A problem affecting a high-volume product template may deserve more attention than an issue on a rarely visited page.
- 2
Severity of the friction.
How significant is the behavioral drop-off? Is this normal attrition through a funnel, or does the data indicate an unusually weak transition?
- 3
Business value.
Which products, customer groups or journeys contribute most meaningfully to revenue and customer value? Not every conversion has equal strategic importance.
- 4
Confidence in the diagnosis.
How much evidence supports the hypothesis? One unusual metric should not automatically trigger a major redesign. Look for supporting evidence across analytics, customer behavior and business context.
This creates a more disciplined way to allocate optimization resources.
When Should You A/B Test?
Experimentation becomes especially useful once you have a meaningful hypothesis.
An A/B test should answer a business question.
For example:
Will simplifying product-page information improve add-to-cart behavior among mobile visitors?
or:
Will making shipping expectations clearer earlier in the journey increase checkout completion?
That is different from testing random button colors because an optimization article recommended it.
Your analytics should help determine what deserves to be tested.
Experimentation then helps determine whether the proposed solution actually improves customer behavior.
For brands with sufficient traffic and transaction volume, this creates a repeatable optimization cycle:
Measure → Identify → Hypothesize → Test → Learn → Improve
When Does an Ecommerce Website Actually Need a Redesign?
Sometimes a redesign is absolutely appropriate.
But analytics should help inform that decision too.
A broader redesign may deserve consideration when problems are structural:
- customers consistently struggle with navigation
- product discovery no longer matches the assortment
- mobile usability is poor across major templates
- the platform or architecture limits important customer experiences
- brand positioning has substantially evolved
- multiple parts of the journey create friction
- technical limitations prevent meaningful optimization
But if analytics reveals one concentrated problem, perhaps checkout abandonment or weak performance within a specific product template, a full redesign may be unnecessary.
The question should not be:
“Is our website old?”
It should be:
“Is the current digital experience preventing customers from accomplishing what they came here to do?”
That is a much stronger basis for investment.
What Should a Growing Ecommerce Brand Measure?
There is no single dashboard that answers every business question.
But a useful ecommerce measurement framework should connect acquisition, behavior and business outcomes.
Depending on the business, that may include:
Acquisition
- users and sessions
- traffic source
- campaign
- landing page
- new vs. returning visitors
Shopping behavior
- product views
- product discovery
- on-site search
- add-to-cart behavior
- cart abandonment
- checkout initiation
- checkout progression
Business outcomes
- purchases
- conversion rate
- revenue
- average order value
- revenue by channel
- revenue by product or category
- customer acquisition performance
- repeat purchase behavior where measurable
The objective is not to build the largest possible dashboard.
It is to create enough visibility to answer:
Where is growth being created?
Where is it being lost?
What should we improve next?
The Best Ecommerce Optimization Strategy Starts With Better Questions
A low conversion rate is not a diagnosis.
It is a signal.
The opportunity is to investigate the customer journey beneath that number.
Where are customers dropping?
Which segments are struggling?
Which products behave differently?
Does the problem begin with acquisition, product discovery, product evaluation, cart behavior or checkout?
What evidence supports the diagnosis?
And which improvement would create the greatest business impact if it worked?
Those questions turn analytics from reporting into a growth capability.
Instead of redesigning pages based on opinion or implementing disconnected “best practices,” growing ecommerce brands can use customer behavior to decide where to focus, develop stronger hypotheses and measure whether their changes actually improve performance.
That is how analytics becomes more than a dashboard.
It becomes a system for deciding what to optimize next.
Frequently Asked Questions
Why is my ecommerce website getting traffic but not sales?
There is no single cause. Start by determining where visitors drop out of the buying journey. Compare product views, add-to-cart behavior, checkout initiation and purchases, then segment performance by traffic source, device, landing page and other meaningful dimensions. This helps distinguish a traffic-quality problem from a website-experience problem.
What ecommerce metrics should I track in GA4?
Useful metrics depend on the business question, but growing ecommerce brands should generally understand acquisition, product views, add-to-cart behavior, checkout initiation, purchases and revenue. These should be analyzed across meaningful segments rather than viewed only as sitewide totals.
Should I redesign my ecommerce website if conversion rate is low?
Not automatically. Diagnose where the problem occurs first. A structural customer-experience problem may justify a broader redesign, while a concentrated issue within a particular stage of the funnel may require a much more targeted optimization.
How do I know what to optimize first on my ecommerce website?
Prioritize opportunities based on the size of the affected audience, severity of the friction, potential business value and confidence in your diagnosis. The objective is to address the highest-value customer problem rather than simply the easiest website element to change.
Clarity Before Optimization
Know What to Fix Before You Invest in Fixing It.
When your ecommerce performance is under pressure, the answer isn't always another redesign, tool or marketing tactic.
CNR Digital's Growth Intensive helps businesses examine the digital experience, customer journey and measurement behind performance, identify the highest-value opportunities and build a prioritized roadmap for what to improve next.
Explore the Growth IntensivePrefer to talk through your digital presence first? Start a conversation with CNR Digital.